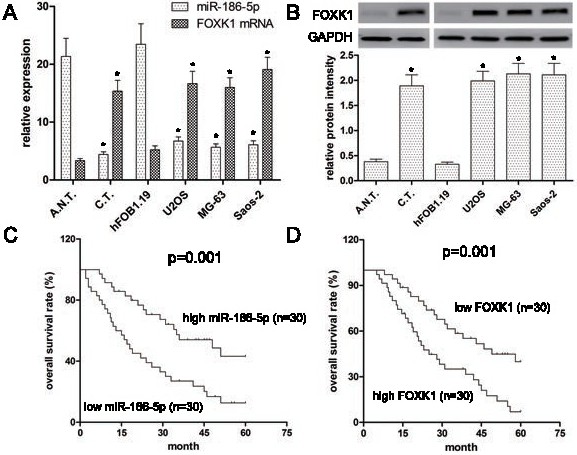
Fig. 1. Expressions of miR-186-5p and FOXK1 in OS tissues and cell lines, and their association with prognosis. (A) qRT-PCR was performed to measure the expression of miR-186-5p and FOXK1 mRNA in OS cells, cancer tissues (C.T.) and adjacent normal tissues (A.N.T.). The bands were measured by densitometry with Quantity One quantitation analysis software package. U6 and GAPDH were used for loading normalization. (B) Western blot was performed to measure the relative expression of FOXK1 protein in human OS tissues and cell lines (U2OS, MG-63 and Saos-2) compared with normal tissues and human osteoblast cell line hFOB1.19. (C,D) The Kaplan Meier plotter was employed to analyze the prognosis of patients with OS. Data are presented as mean ± SD of at least three independent experiments *P<0.001 vs. control.